Test Methodology
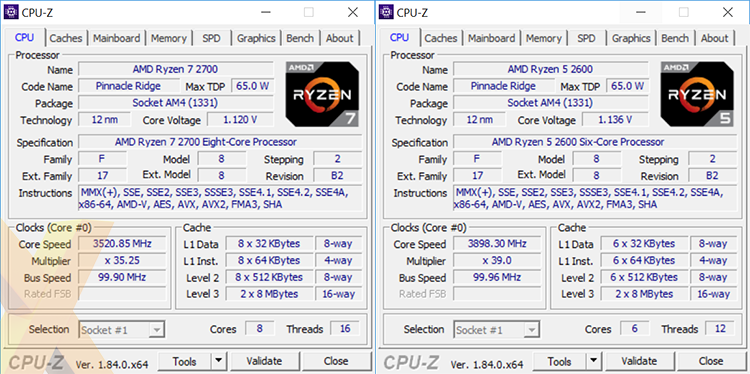
AMD Ryzen 7 2700 and Ryzen 5 2600 Specifications |
|---|
 |
AMD Ryzen Processor Configurations |
|||||||||
|---|---|---|---|---|---|---|---|---|---|
| CPU | Ryzen 7 2700X |
Ryzen 7 2700 |
Ryzen 7 1800X |
Ryzen 5 2600X |
Ryzen 5 2600 |
Ryzen 5 1600X |
|||
| CPU Base Clock | 3.7GHz |
3.2GHz |
3.6GHz |
3.7GHz |
3.4GHz |
3.6GHz |
|||
| CPU Turbo Clock | 4.3GHz |
4.1GHz |
4.0GHz |
4.2GHz |
3.9GHz |
4.0GHz |
|||
| CPU L3 Cache | 16MB |
16MB |
16MB |
16MB |
16MB |
16MB |
|||
| CPU Cores / Threads | 8 / 16 |
8 / 16 |
8 / 16 |
6 / 12 |
6 / 12 |
6 / 12 |
|||
| CPU TDP | 105W |
65W |
95W |
95W |
65W |
95W |
|||
| Integrated Graphics | - |
- |
- |
- |
- |
- |
|||
| Shaders | - |
- |
- |
- |
- |
- |
|||
| IGP Turbo Clock | - |
- |
- |
- |
- |
- |
|||
| Socket | AM4 |
AM4 |
AM4 |
AM4 |
AM4 |
AM4 |
|||
| Lithography | 12nm |
12nm |
14nm |
12nm |
12nm |
14nm |
|||
| Motherboard | Aorus X470 Gaming WiFi 7 |
||||||||
| BIOS | T2b |
||||||||
| Memory | Corsair Vengeance 32GB DDR4 |
||||||||
| Memory Config | 4x8GB |
||||||||
| Memory Timings | 16-18-18-38-1T |
||||||||
| Memory Speed | 2,933MHz |
2,666MHz |
2,933MHz |
2,666MHz |
|||||
| Disk Drive | SK hynix Canvas SC300 (512GB) |
||||||||
| Power Supply | be quiet Dark Power Pro 11 (1,000W) |
||||||||
| Graphics Card | Nvidia GeForce GTX 1080 Ti (391.25) |
||||||||
| CPU Cooler | Noctua NH-D15S |
||||||||
| Operating System | Microsoft Windows 10 (64-bit) |
||||||||
Intel Core Processor Configurations |
|||||||
|---|---|---|---|---|---|---|---|
| CPU | Core i7-8700K |
Core i5-8400 |
Core i3-8100 |
Core i7-6700K |
|||
| CPU Base Clock | 3.7GHz |
2.8GHz |
3.6GHz |
4.0GHz |
|||
| CPU Turbo Clock | 4.7GHz |
4.0GHz |
- |
4.2GHz |
|||
| CPU Cache | 12MB |
9MB |
6MB |
8MB |
|||
| CPU Cores / Threads | 6 / 12 |
6 / 6 |
4 / 4 |
4 / 8 |
|||
| CPU TDP | 95W |
65W |
65W |
91W |
|||
| Integrated Graphics | UHD 630 |
UHD 630 |
UHD 630 |
HD 530 |
|||
| IGP Base Clock | 350MHz |
350MHz |
350MHz |
350MHz |
|||
| IGP Turbo Clock | 1,200MHz |
1,050MHz |
1,100MHz |
1,150MHz |
|||
| Socket | LGA 1151 v2 |
LGA 1151 v1 |
|||||
| Lithography | 14nm |
||||||
| Motherboard | Asus Maximus X Hero |
Gigabyte Z170XP-SLI |
|||||
| BIOS | 1101 |
F22f |
|||||
| Memory | Corsair Vengeance 32GB DDR4 |
||||||
| Memory Config | 4x8GB |
||||||
| Memory Timings | 16-18-18-38-1T |
||||||
| Memory Speed | 2,666MHz
|
2,400MHz |
|||||
| Disk Drive | SK hynix Canvas SC300 (512GB) |
||||||
| Power Supply | be quiet Dark Power Pro 11 (1,000W) |
||||||
| Graphics Card | Nvidia GeForce GTX 1080 Ti (391.25) |
||||||
| CPU Cooler | Noctua NH-D15S |
||||||
| Operating System | Microsoft Windows 10 (64-bit) |
||||||
Benchmark Suite |
||||||||||||
|---|---|---|---|---|---|---|---|---|---|---|---|---|
| CPU Benchmarks | ||||||||||||
| HEXUS PiFast | Our number-crunching benchmark stresses a single core by calculating Pi to 10m places | |||||||||||
| Blender 2.79b | Using all available cores, we run the BMW CPU_Blend benchmark | |||||||||||
| Cinebench | Using Cinebench's multi-CPU render, this cross-platform benchmark stresses all cores | |||||||||||
| HandBrake 1.1.0 | Free-to-use video encoder that stresses all CPU cores (64-bit) | |||||||||||
| Memory Benchmarks | ||||||||||||
| AIDA64 v5.79.4600 | Benchmark that analyses memory bandwidth and latency | |||||||||||
| Gaming Benchmarks (Nvidia GeForce GTX 1080 Ti) | ||||||||||||
| 3DMark | Graphics benchmark run using Fire Strike and Time Spy tests | |||||||||||
| VRMark | Virtual reality benchmark run using the Cyan Room test | |||||||||||
| F1 2017 | 1,920x1,080 and 3,840x2,160, ultra settings | |||||||||||
| Far Cry 5 | 1,920x1,080 and 3,840x2,160, ultra settings | |||||||||||
| Middle-earth: Shadow of War | 1,920x1,080 and 3,840x2,160, ultra settings | |||||||||||
| Total War: Warhammer 2 | 1,920x1,080 and 3,840x2,160, ultra settings | |||||||||||
| Miscellaneous Benchmarks | ||||||||||||
| Power Consumption | To emulate real-world usage scenarios, we record system-wide mains power draw when idle, when encoding video via HandBrake and while playing Far Cry 5 | |||||||||||
Notes
We have tested a bunch of processors from scratch. The graphics card has been moved on over to a reference GeForce GTX 1080 Ti, we have added all-core-beating Blender, and changed the games and their resolution, now testing at 1080p and 4K. The reason for this change rests with the recent Windows and BIOS updates against Spectre and Meltdown threats identified earlier in the year. A Windows patch on April 10 enabled full protection for the AMD chips, while Intel's 8th Gen Core series was protected earlier.
We have also benchmarked the Intel Core i7-6700K, released in August 2015, to see if it makes any sense to upgrade a performance processor from roughly three years ago. The comparison is relevant because it cost £275 at the time of launch, which is roughly the same price as the Ryzen 7 2700.


