Average Relative Performance, Value, Energy Efficiency

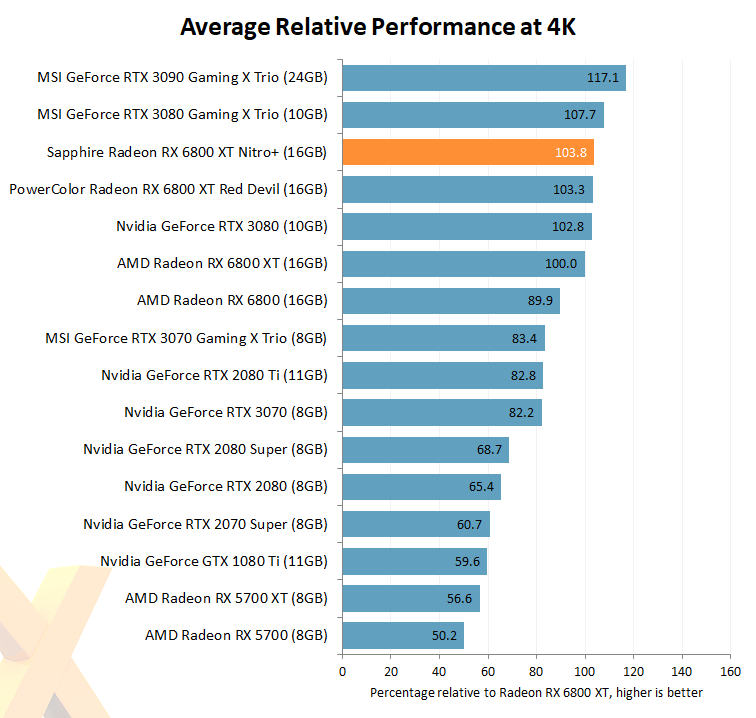
Looking at the relative 4K performance of each card and normalising numbers to the AMD Radeon RX 6800 XT across seven rasterisation titles gives greater insight into how everything really stacks up.
Sapphire Nitro+ is fractionally faster than the PowerColor Red Devil. There's so little in it that you won't notice it in a game. Both are up to four per cent faster than the reference board yet fall short of matching MSI's impressive RTX 3080 Gaming X Trio. The performance gap between GeForce and Radeon will increase if ray tracing titles are involved.

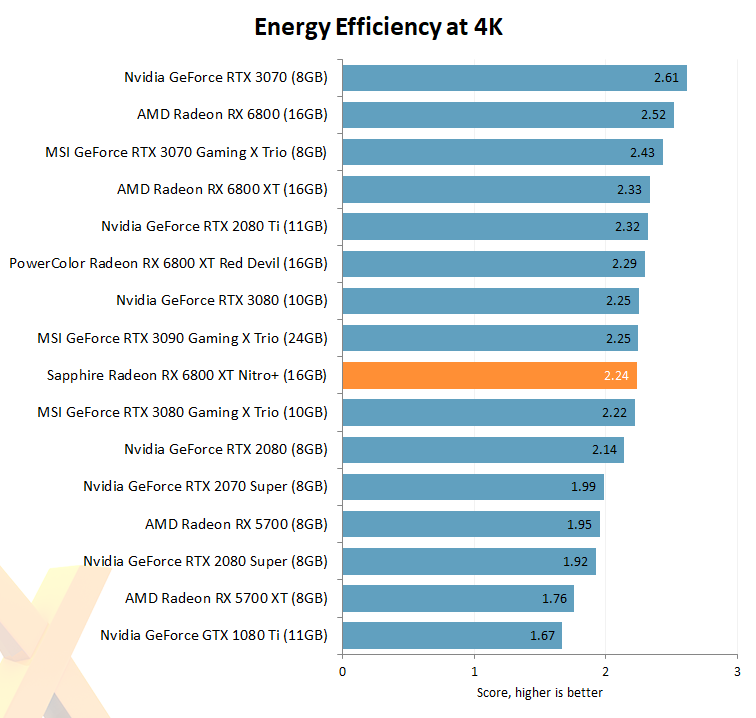
We can also tease out rudimentary comparative value and energy efficiency by looking at performance and evaluating it against power consumption and price.
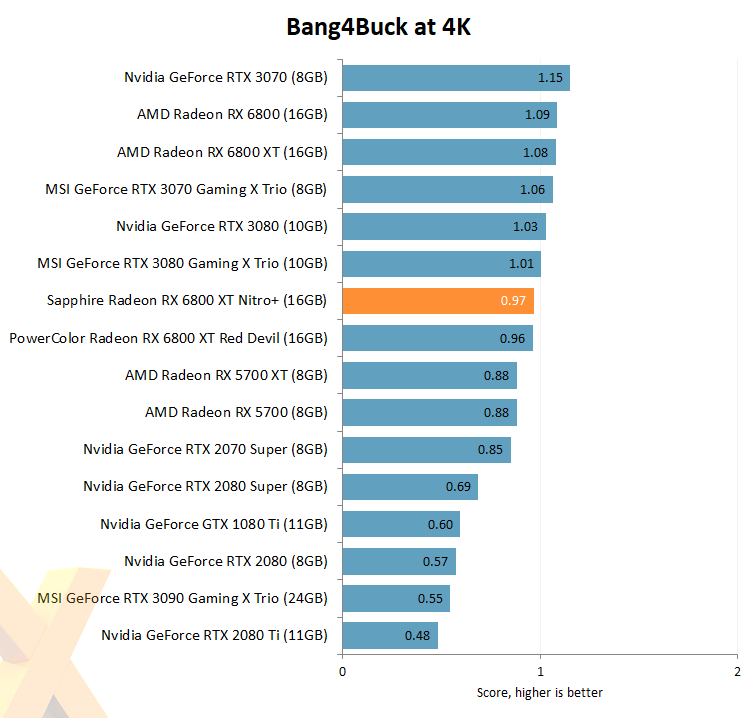
Taking the same relative performance in the first graph and plotting it against the dollar SRP - which in times of stock constraint is only a guide - gives us the following graph. It's the relative positions that are important, not the absolute score.
We're working this out with the Sapphire at $750. It's faster than the AMD's $650 reference board but the guesstimated price is higher by a larger percentage hence the lower position.

Arriving with a 350W TDP doesn't do the Nitro+ many favours in the energy-efficiency department. It's interesting that GeForce RTX 3080 and RTX 3090 sandwich it.


