Relative Performance, Value and Energy Efficiency

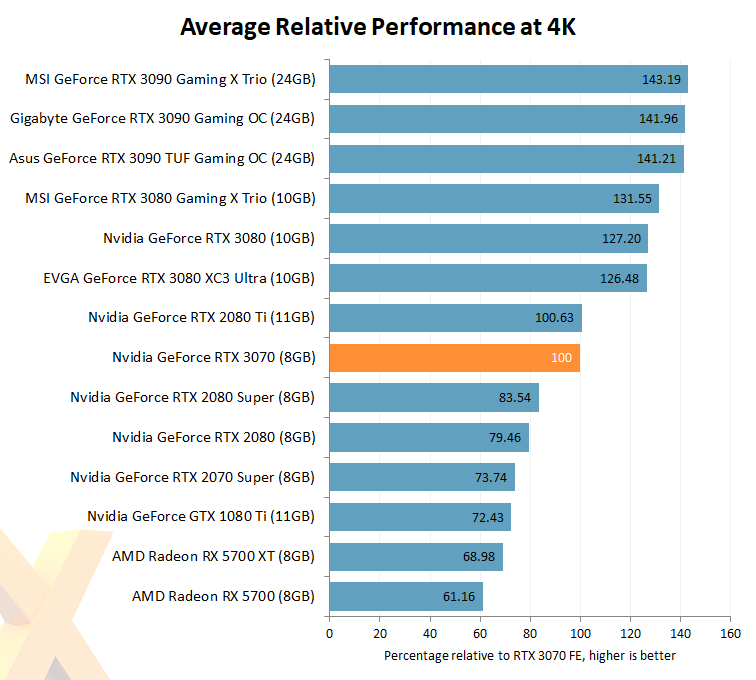
Looking at the relative 4K performance of each card and normalising numbers to the RTX 3070 FE across seven rasterisation titles gives greater insight into how it really stacks up.
Our numbers suggest RTX 2070 Super FE offers, on average, 73.74 percent of its performance, whilst the RTX 3080 FE does between 126 and 132 percent, depending upon card implementation.
It's also clearly bang on the RTX 2080 Ti FE money, which is no coincidence. Nvidia can rightfully claim to be offering the same level of performance as last-year's champ at half the money... conveniently ignoring the 3GB deficit for onboard memory.

We can also tease out rudimentary comparative value and energy efficiency by looking at performance and evaluating it against power consumption and price.
To get these figures we divide the Gears 5 4K average framerate - a well-coded game that scales well - by the peak graphics power consumption seen in GPU-Z, which tallies closely to each card's declared TDP.
A 220W TDP plays well with how much the RTX 3070 FE has to offer, so it's no surprise to see it equal top of the charts here.

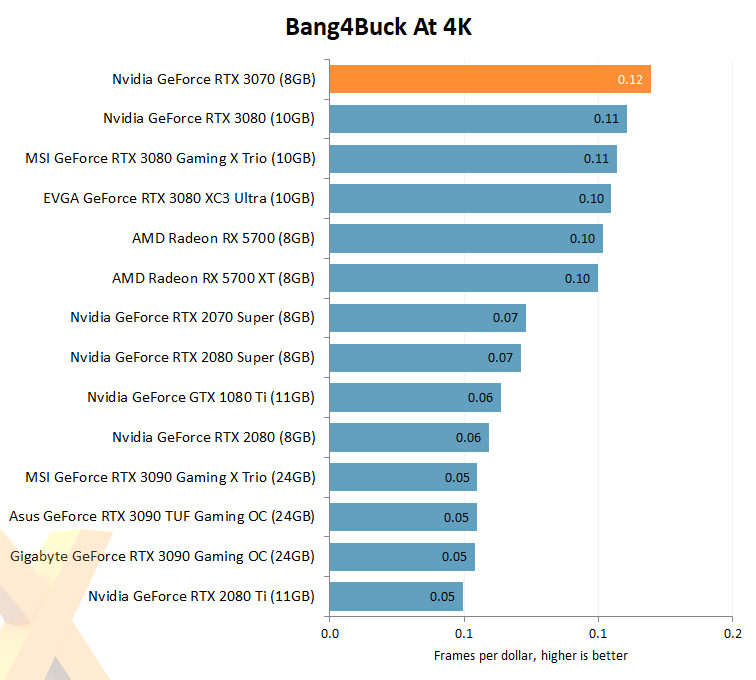
We can also look at basic value by determining how many fps the card achieves per dollar of SRP pricing. RTX 3070 FE achieves 60fps and costs $499, which translates to a class-leading 0.12 fps (60/499) per dollar.
The RTX 2080 Ti FE, meanwhile, achieves the same framerate but at twice the cost, hence it being stuck at the very bottom.


