Nvidia has released the first public beta of FrameView, a new benchmarking tool based upon a modified version of PresentMon. The new tool is designed to fill a gap observed by Nvidia, to provide a single app that can report accurate frame rates, frame times, power usage, performance per watt, and more. FrameView Beta is currently at version 0.9.4124.26691055 and is quite a compact app by today's standards, weighing in at a 23MB download.
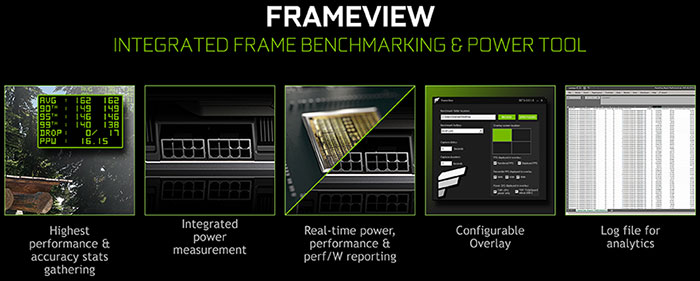
Key features of Nvidia FrameView are:
- It can capture data from DirectX 9, 10, 11 and 12, OpenGL, Vulkan, and Universal Windows Platform (UWP) applications in full screen and windowed modes,
- It supports multiple GPU configurations,
- It supports G-Sync, Non-G-Sync, ASync (including FreeSync) single monitor setups,
- It is a lightweight app with minimal overheads,
- It includes an integrated overlay for performance stats during gameplay,
- It is vendor agnostic - i.e. it works on Nvidia, AMD, Intel and other GPUs
- But it requires Windows 10.
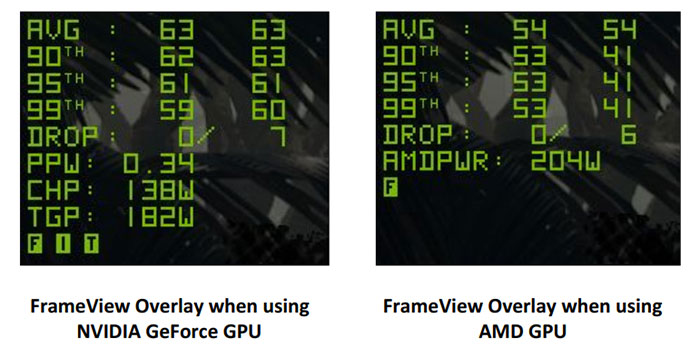
Nvidia does highlight one wrinkle in its FrameView data reporting - the power tracking stats will be inaccurate with regard to AMD graphics hardware. In particular, it suggests that "AMD's GPU power consumption API reports a value in-between chip power and board power, rather than the true values." Thus, in the FrameView app release notes, Nvidia asserts that "Until AMD describes what their API is reporting, Nvidia to AMD power comparisons are NOT apples-to-apples."
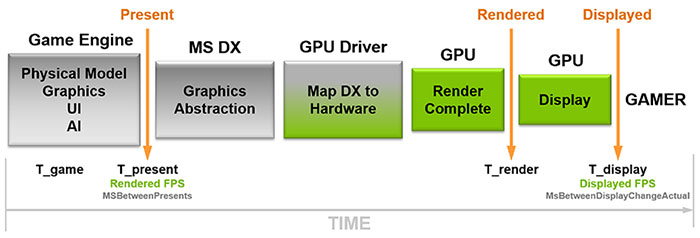
In use the FrameView tool, displays performance data in two labelled columns. On the left side are rendered frame rates from the beginning of the graphics piepline and to the right are displayed frame rates, from, the end of the pipeline. Please refer to the diagram above.
Below the average frame rates you will see the 90th, 95th and 99th percentile frame rates, which give an indication of gameplay smoothness. Moving lower, the data reported shows frames dropped, a representation of performance per watt (calculated as FPS ÷ TGP). CHP is the power consumption of the GPU chip, and TGP is the total power consumption of the chip and board in watts.
At the bottom of the overlay stats list you will see an overlay mode tag. Various letters indicate the following: F = Full Screen, W = Windowed mode, I = Independent flip, T = tearing, V = V-Sync on.
When running FrameView, performance data is saved in log files which you can further analyse. This data is in CSV form, which can be loaded into spreadsheet software like Excel or similar, and then you can craft useful performance and comparison charts and graphs.
FrameView is now available for free, and you can check out the user guide here (PDF). In the downloaded app you will find some notes on known issues.